Capture Engine capture window graphs
The Graphs view of a Capture Engine capture window can show multiple graphs, each one of which can show one or more statistics items from any combination of the following views: Summary, Nodes, Protocols, Applications, Countries, and WLAN statistics.
A graph enabled in the Graphs list is shown in the right pane. When multiple graphs are enabled, they are stacked vertically. All graphs share the same horizontal time axis.
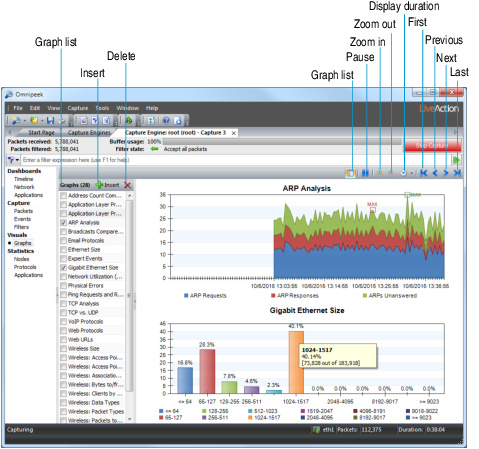
The parts of the Capture Engine Graphs view are described below.
• Insert: Click to add an existing graph template to the Graphs list by opening the Graph Templates dialog.
• Delete: Click to remove selected graph template(s) from the Graphs list. (The deleted graph template will be restored to the list in the Graph Templates dialog.)
• Graph list: Click to toggle the display of the Graphs list.
• Pause: Click to toggle the update of all graphs, preventing them from automatically scrolling to the right at each new sampling interval.
• Zoom in: Click to enlarge the size of the display.
• Zoom out: Click to reduce the size of the display.
• Display duration: Use the drop-down list beside to select the time window (left-right expanse) displayed for all graphs. A shorter interval has the effect of zooming in, a longer interval, of zooming out.
• First, Previous, Next, Last: Use these buttons to scroll through the graphs when is clicked (active).
• Right-click options:
• Gallery: Select alternative graph displays
• Legend: Toggles display of the graph legend.
• Copy: Copies the graph image to the clipboard.
• Print: Opens the Print dialog for printing the graph.
To add an existing graph template to the Graphs list:
1. Click . The Graph Templates dialog appears.
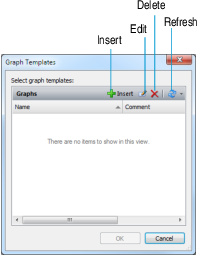
2. Select the check box beside any graph template you wish to add to the Graphs list of the Capture Engine capture window.
3. Click .
To create a new graph template, choose one of the following:
• Click in the Graph Templates dialog.
• Select statistics items directly in the Nodes, Protocols, or Summary views of Capture Engine capture windows and click in the toolbar.
The Create Graph Template dialog appears. For a details, see Capture Engine graph templates.
TIP: To open a window that shows only the Graphs view of a Capture Engine capture window, right-click its listing in the Captures view of the Capture Engines window and choose . This allows you to monitor and manage the Graphs view of the Capture Engine capture window using minimal bandwidth and processing power.